











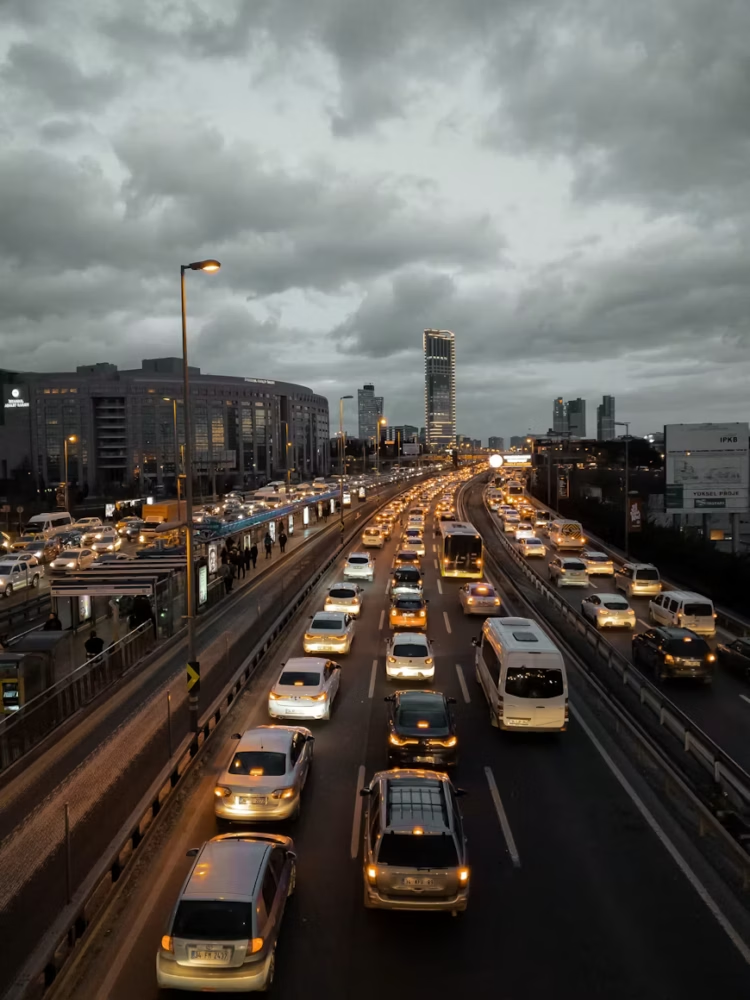

A new study from promotional products company Pens.com has identified the UK’s most trafficked roads, revealing the best locations for businesses to maximise exposure through roadside advertising.
The analysis of Department for Transport data shows that Hounslow in west London offers advertisers the greatest potential audience, with an average of 232.2 vehicles passing over each kilometre of road every hour – nearly 50 times more than the least trafficked area. Hillingdon, another west London borough, ranks second with 225.2 vehicles per hour per kilometre of road. This high volume reflects its position as home to Heathrow Airport and several major motorways.
Thurrock in Essex takes third place with 210.7 vehicles hourly per kilometre, benefiting from its location near the M25 and Dartford Crossing, key routes for commuters and freight transport into London.
Cardiff is the highest-ranked non-English location, placing fourth with 201.9 vehicles per hour per kilometre. As Wales’ capital city, its road network handles significant commuter traffic and serves as a regional transport hub.
Enfield in north London ranks fifth with 200.4 vehicles hourly per kilometre, while Salford in Greater Manchester places sixth with 199.6, representing the highest-ranked location in northwest England.
Kingston upon Thames and Tower Hamlets follow closely in seventh and eighth positions with 197.8 and 197.7 vehicles per hour, respectively, continuing London’s dominance in the rankings.
Warrington ranks ninth with 194.5 vehicles hourly per kilometre, while Bury completes the top ten with 193.0, representing another strong showing for Greater Manchester.
The data shows a clear pattern of higher traffic volumes in and around major urban centres, particularly London, with significant regional variations reflecting population density and economic activity.
Table: Top 10 UK Local Authorities by Hourly Traffic Volume
| Rank | Local Authority | Region | Vehicles Per Hour Per KM | Daily Vehicles Per KM |
| 1 | Hounslow | London | 232.2 | 5,572.6 |
| 2 | Hillingdon | London | 225.2 | 5,404.0 |
| 3 | Thurrock | East of England | 210.7 | 5,056.0 |
| 4 | Cardiff | Wales | 201.9 | 4,845.2 |
| 5 | Enfield | London | 200.4 | 4,809.0 |
| 6 | Salford | Greater Manchester | 199.6 | 4,791.2 |
| 7 | Kingston upon Thames | London | 197.8 | 4,747.2 |
| 8 | Tower Hamlets | London | 197.7 | 4,745.8 |
| 9 | Warrington | Cheshire | 194.5 | 4,667.9 |
| 10 | Bury | Greater Manchester | 193.0 | 4,633.1 |
At the other end of the scale, the study identified areas with significantly lower traffic volumes, presenting much reduced opportunities for roadside advertising impact.
The Isles of Scilly recorded the lowest traffic density in the UK, with just 4.7 vehicles per hour per kilometre of road. The islands’ small resident population and limited road network contribute to this low figure.
The Orkney Islands ranked second-lowest with 9.9 vehicles hourly per kilometre, followed by Comhairle nan Eilean Siar (Western Isles) with 12.4, highlighting the pattern of remote island communities having minimal traffic.
The Shetland Islands placed fourth from bottom with 15.4 vehicles per hour per kilometre, continuing the trend of Scottish island communities featuring prominently among areas with the lowest traffic volumes.
Powys in Wales ranks fifth from bottom with 21.5 vehicles hourly per kilometre. As the largest county in Wales by area but with a relatively small population, its vast rural landscape results in minimal traffic density.
Ceredigion, another Welsh local authority, follows with 23.7 vehicles per hour per kilometre, reflecting its predominantly rural character and smaller towns.
Argyll & Bute in Scotland ranks seventh from bottom with 25.2 vehicles hourly per kilometre, while the Scottish Borders and Highland council areas tie for eighth lowest with 27.3 each.
Pembrokeshire in southwest Wales completes the bottom ten with 30.8 vehicles per hour per kilometre, despite being a popular tourist destination during summer months.
Table: 10 UK Local Authorities with Lowest Hourly Traffic Volume
| Rank | Local Authority | Region | Vehicles Per Hour Per KM | Daily Vehicles Per KM |
| 1 | Isles of Scilly | South West England | 4.7 | 112.2 |
| 2 | Orkney Islands | Scotland | 9.9 | 237.5 |
| 3 | Comhairle nan Eilean Siar | Scotland | 12.4 | 297.3 |
| 4 | Shetland Islands | Scotland | 15.4 | 370.6 |
| 5 | Powys | Wales | 21.5 | 514.9 |
| 6 | Ceredigion | Wales | 23.7 | 568.6 |
| 7 | Argyll & Bute | Scotland | 25.2 | 604.8 |
| 8 | Scottish Borders | Scotland | 27.3 | 655.2 |
| 9 | Highland | Scotland | 27.3 | 655.4 |
| 10 | Pembrokeshire | Wales | 30.8 | 738.4 |
A spokesperson from Pens.com commented on the findings:
“This data provides key insights for businesses considering roadside advertising opportunities. The difference in traffic flow between urban and rural areas demonstrates the need for targeted approaches based on location. What stood out to us was Thurrock in Essex ranking above most London boroughs. It shows how logistics hubs and crossing points like the Dartford Crossing can generate enormous traffic volumes that businesses might not expect.”

| [donate]
| Help keep news FREE for our readersSupporting your local community newspaper/online news outlet is crucial now more than ever. If you believe in independent journalism,then consider making a valuable contribution by making a one-time or monthly donation. We operate in rural areas where providing unbiased news can be challenging. |